
US Rents Turn Positive Year Over Year for First Time Since 2023
Apartment List says national rent rose 0.1% year over year in October, the first annual gain since mid-2023, though vacancy stays high and concessions spread.

Key points
- National median rent was $1,384 in October, up 0.1% from a year earlier but down 0.3% from September.
- Vacancy was 7.0%, and 32% of listings offered at least one month of free rent.
- San Francisco and San Jose lead growth, while San Antonio and other Sun Belt markets keep falling.
In this article
Rents across the United States edged above year-ago levels in October for the first time in more than three years, but the gain was tiny, and renters in many markets are still being offered discounts. That is the picture from Apartment List's national rent report, published Oct. 28.
The headline numbers
Apartment List put the national median rent at $1,384 for October: $1,215 for a one-bedroom and $1,369 for a two-bedroom. That is 0.1% higher than a year earlier, which the company describes as the first positive annual reading since mid-2023, and it said the improvement was "just barely." On a monthly basis, rent fell 0.3%, the second straight decline, which the report attributes to the usual off-season slowdown.
For comparison, the company's September data, released Oct. 12, showed a $1,388 median, a 0.1% monthly decline and a 0.4% drop from a year earlier. In other words, the annual figure moved from slightly negative to slightly positive in a month. The report also notes that rents are still flat in nominal terms and falling after inflation.
Vacancy and concessions
Apartment List's vacancy index was 7.0% in October, down from a 7.3% peak in February but above the 2017-2019 average of 6.4%. The company also reported that 32% of properties were offering concessions worth at least one month of free rent, up from 28% a year earlier. Apartments took a median of 36 days to rent, the longest October reading since the company began tracking in 2019. A summary of the report by Chandan Economics quoted its conclusion that improving headline rents "have yet to eliminate leasing incentives."
Where rents are rising and falling
- Fastest growth: The San Francisco metro area was up 13% from a year earlier and San Jose up 9%. The city of San Francisco itself was up 24% and had the highest median rent among the top 100 cities, at $3,843.
- Sharpest declines: San Antonio fell 3.8% year over year, the largest drop among large metros. Austin was down 1.2%, an improvement from -6.2% in 2025, and Denver, Phoenix, Tampa and Charlotte remained among the weakest.
- Breadth: Of the 55 largest metros, 45 posted monthly declines and 35 posted year-over-year increases.
- Lowest rent: Toledo, Ohio had the lowest median among the top 100 cities, at $895.
Separately, Chandan Economics' NYC Rent Growth Monitor found New York City metro rents up 4.3% year over year, compared with 2.9% nationally in its measure, with the Bronx leading at 6.2%. Different companies measure rents differently, which is why national figures vary from one report to the next.
What this means for renters
- Renewal leverage exists in soft markets. With elevated vacancy and free-rent offers still common, tenants in the Sun Belt and other weaker metros may be able to negotiate a smaller increase or ask for a concession. Comparing your rent with similar listings helps.
- Look at total cost. A free month lowers the effective rent but can come with a higher advertised rate that carries into renewal. Ask what your rent becomes after the first lease term.
- Tight markets are different. In the Bay Area, renters are seeing sharp increases, and tenants there should check local rent-control and notice rules. See our report on New York City's rent freeze for another example of rules changing at the local level.
Apartment List's report warns that demand remains uncertain, and its September analysis cited weak consumer sentiment and slowing household formation. Rents may keep drifting in the coming months as the winter season, historically the slowest for leasing, begins.
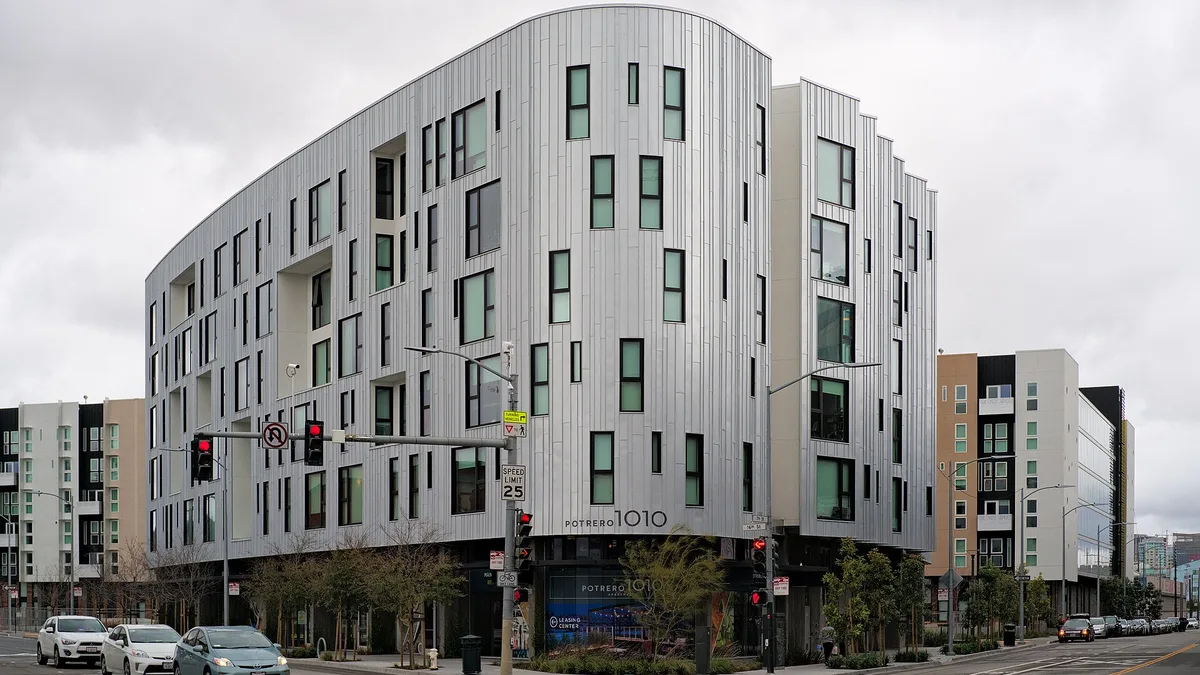
Photo: Potrero 1010 apartments, San Francisco, by Dllu via Wikimedia Commons, CC BY-SA 4.0.
Sources
Gear that could help
Affiliate linksPractical items related to this story, picked by our editors.
As an Amazon Associate, Renter News earns from qualifying purchases.
Find a comfortable rent from your income and debts using the 30% rule, the 50/30/20 budget and the 40x landlord income test.
Related stories
More Rent & Market
Zillow: Rent Growth Speeds Up to 2.7% as Mortgage Rates Climb
Zillow's September report shows typical U.S. rent at $1,932, up 2.7% from a year ago, as high mortgage rates keep would-be buyers in the rental market.

San Francisco Rents Surge While Texas Metros Keep Falling
Fall rent reports show San Francisco leading the nation in rent growth while San Antonio, Denver, Houston and Las Vegas see flat or falling prices for tenants.


Apartment Vacancy Falls to 7% as Rent Market Shows Rebound Signs
Apartment List says vacancy fell to 7% in September and rents dipped only 0.1%, a smaller seasonal drop hinting that the renter-friendly market is cooling.